News
What a successful management change looks like!
21 Dec 2015
Take a look at this little gem we stumbled upon last week-
In early November this farm decided to get serious about monitoring mixing errors in their feed management system, in this case Feed Supervisor. We just happened to have a feed change on 11/7 also. So, between utilizing our feed management software more fully, and a successful feed change we've seen an IOFC gain of $1.56.
Below are three common reports in Dairy Margin Tracker.
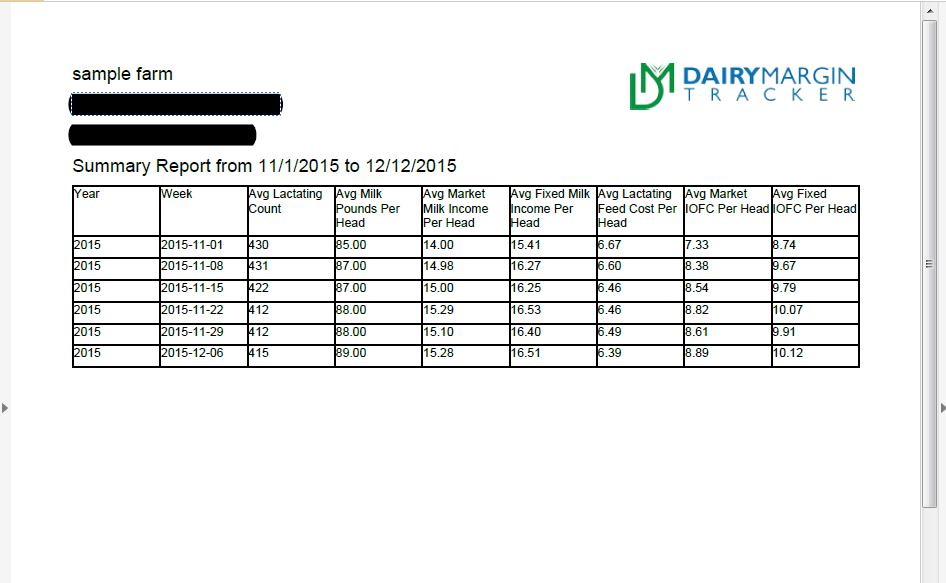
Report#1- Simple chart comparing weekly averages from 11/1/15-12/12/15. Note the Avg Market IOFC per hd change from the week of 11/1 to 12/06.
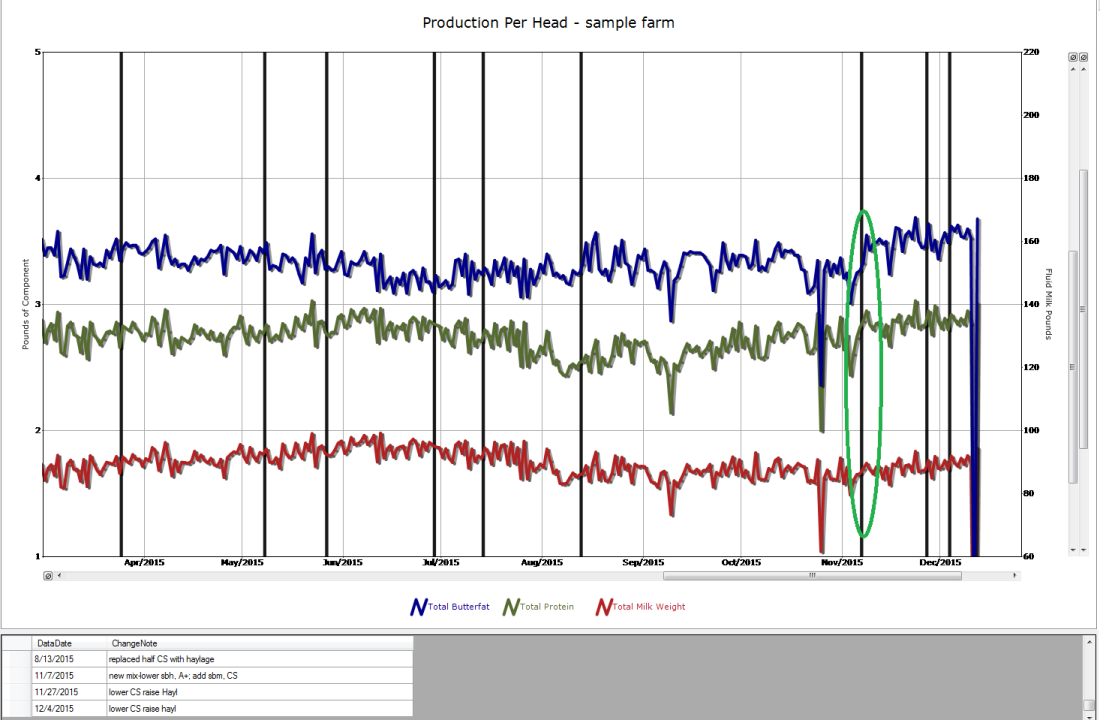
Report#2- Production per head graph- Values are total lbs of Butterfat and Protein, not percentages. Note how component yield jumped up, but lbs of milk/hd did not rise as much. We gained four lbs of milk on this change, but that really doesn't do justice to the IOFC change. Milk lbs is part of it, but component yield and feed cost are pretty significant.
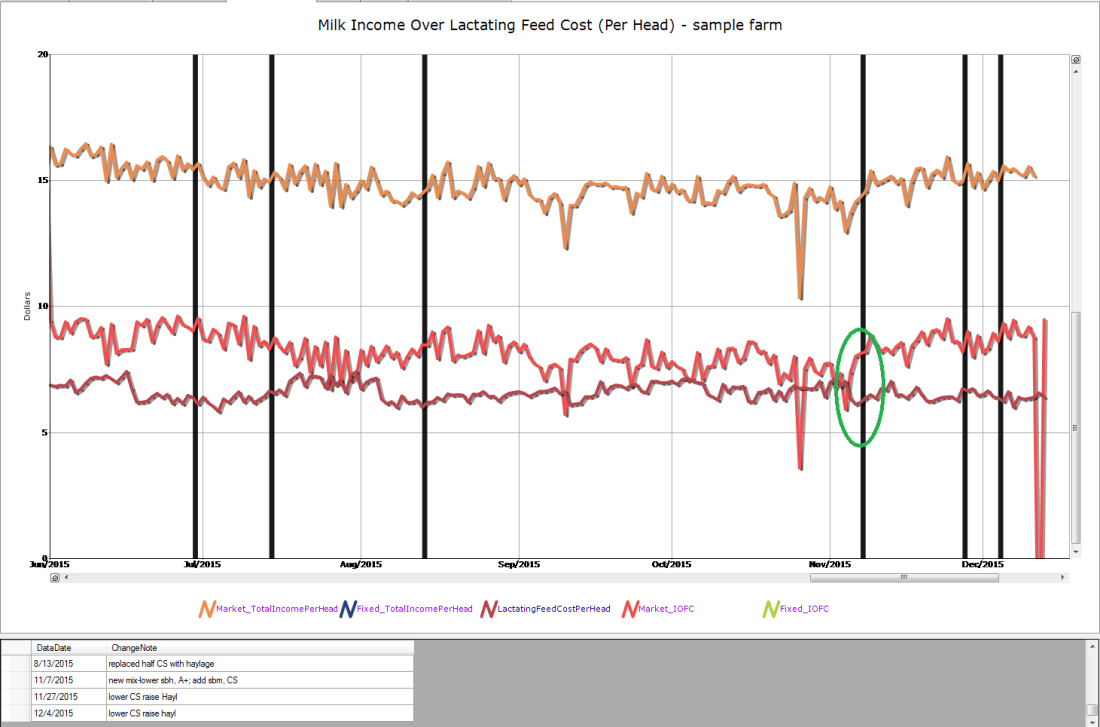
Report#3- Income over feed cost per head graph- Note vertical bold lines in both graphs represent feed or management changes.
Any comments, let me know,
Thanks
Kelly
.png)